10.19.2026 | Millage
What a Property Tax Chart Doesn't Tell Us
Why I took a closer look at Coopersville, nearby cities, and what one mill really brings in.
I recently saw a graphic comparing property tax millage rates around Ottawa County. Coopersville was at the top of that particular list, and it caught my attention.
The numbers made me curious, mostly because I wasn't sure they told the whole story. A property tax bill includes more than the city's own taxes, and cities and townships don't always have the same responsibilities. So I started looking at the county's numbers, then at the budgets and financial reports behind them.
I wasn't trying to prove that Coopersville's taxes are too high or that they're just right. I wanted to understand what the numbers actually mean.
First, what are we comparing?
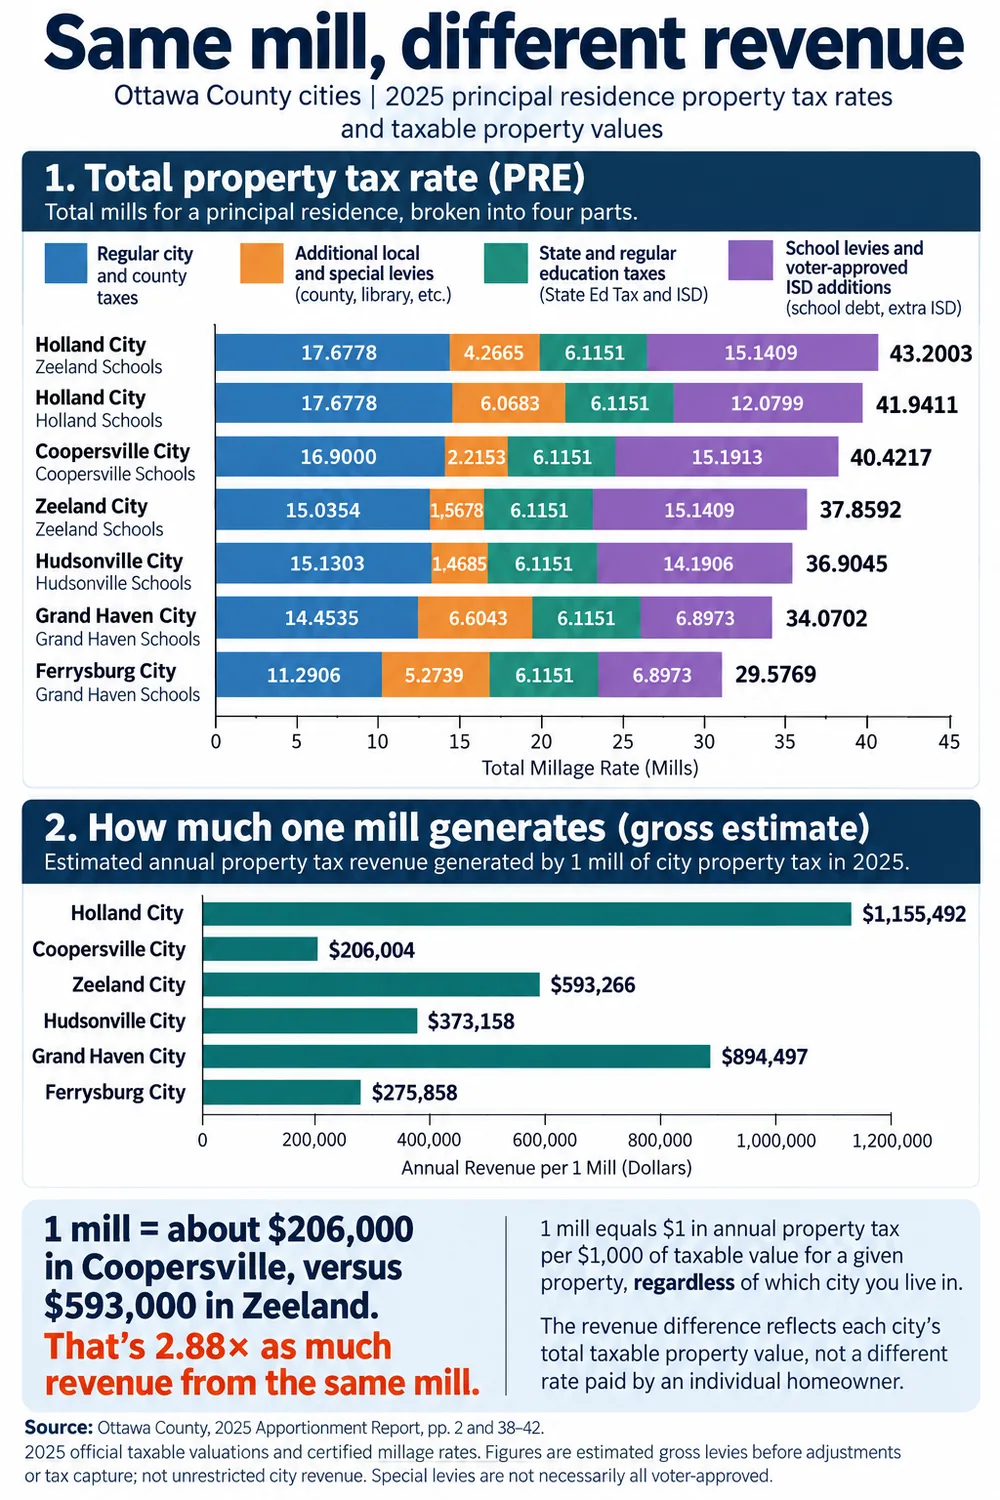
For 2025, the combined property tax rate for a principal residence in Coopersville was 40.4217 mills. But 13 mills of that total were levied by the city itself. The rest came from the county, schools, the state education tax, the intermediate school district, and applicable library taxes.
That difference matters. When someone sees a total rate next to the name of a city, it's easy to assume the city government controls the entire amount. It doesn't.
I also decided to look at cities separately from townships. Cities often have different street, infrastructure, and service responsibilities. That doesn't make every city more expensive or every township less expensive, but it's useful context. And once the other cities were included, Coopersville wasn't at the top of the city-only list. Holland had two city-and-school combinations with higher total rates.
[Infographic 1: City millage rates and revenue generated by one mill]
The same mill raises different amounts of money
This was the part that surprised me most.
In Coopersville, one mill would generate about $206,000 in gross annual property tax revenue based on the 2025 tax base. In Zeeland, one mill would generate about $593,000. That's roughly 2.88 times as much from the same tax rate.
A mill is still a mill. For a homeowner with $100,000 in taxable value, one mill is $100 in annual property taxes in either community. The difference is the amount of taxable property across the entire city.
Coopersville's own city levy was 13 mills in 2025. Zeeland's was approximately 11.23. Even with that lower rate, Zeeland's larger tax base gives it the capacity to raise more property tax revenue.
There's an important qualifier: the graphic shows gross estimates, not the unrestricted dollars each city can actually spend. Tax captures, exemptions, and other adjustments matter. For Holland, the one-mill figure shown covers only the Ottawa County portion of the city, since Holland also extends into Allegan County.
Is it just because Zeeland is bigger?
That was my next question. More people and more property generally mean a larger tax base, so I wanted to look at taxable value per resident rather than only the total.
Using the 2025 taxable values and 2024 population estimates, Coopersville had about $42,400 in taxable value per resident. Zeeland had about $105,200. That's roughly 2.48 times as much taxable value per resident.
[Infographic 2: Taxable value per resident]
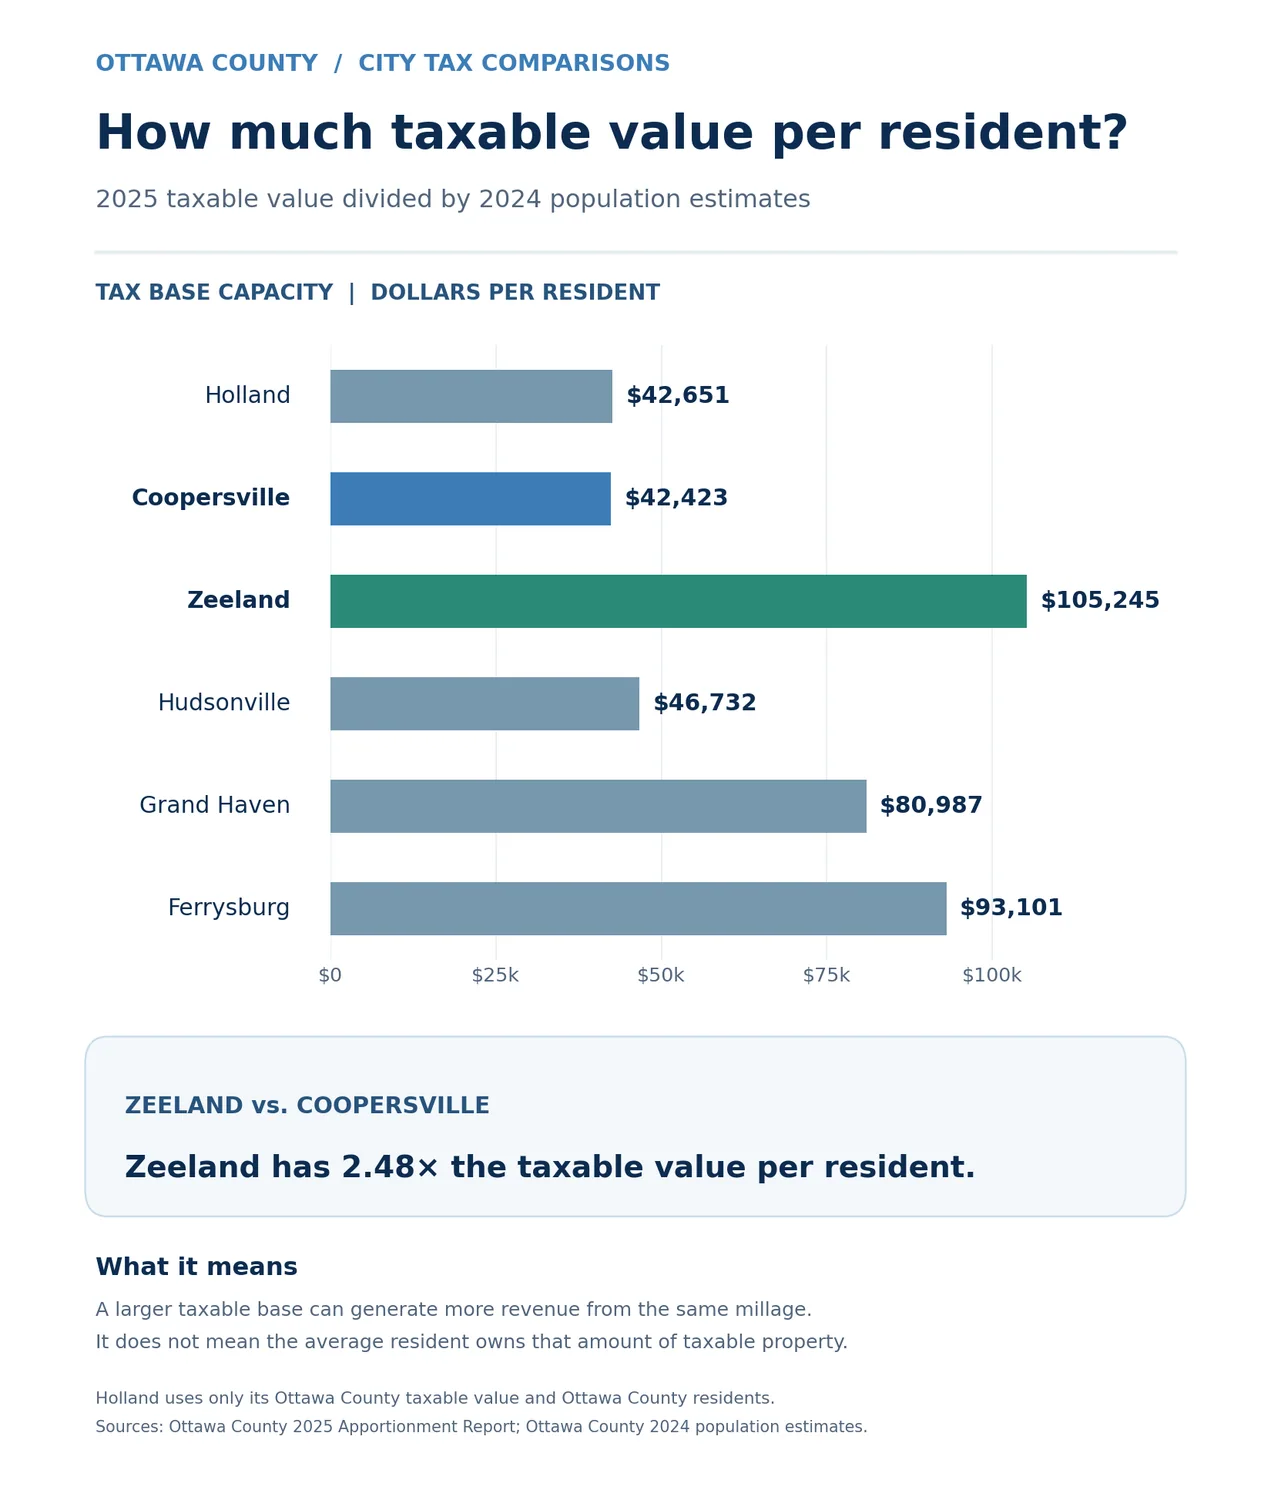
That doesn't mean the average Zeeland resident owns $105,200 in taxable property. The figure includes all taxable property in the community, including commercial and industrial properties. It's a way to understand the size of the tax base relative to the population.
It helps explain why Coopersville needs more mills to raise a given amount. It doesn't tell us whether 13 mills is the right rate, or whether any city is using its resources well.
So what are the cities spending?
I kept going and looked at the cities' audited financial reports. For fiscal year 2025, Coopersville reported approximately $882 in governmental expenses per resident, compared with about $2,309 in Zeeland, $1,898 in Grand Haven, and $1,889 in Holland.
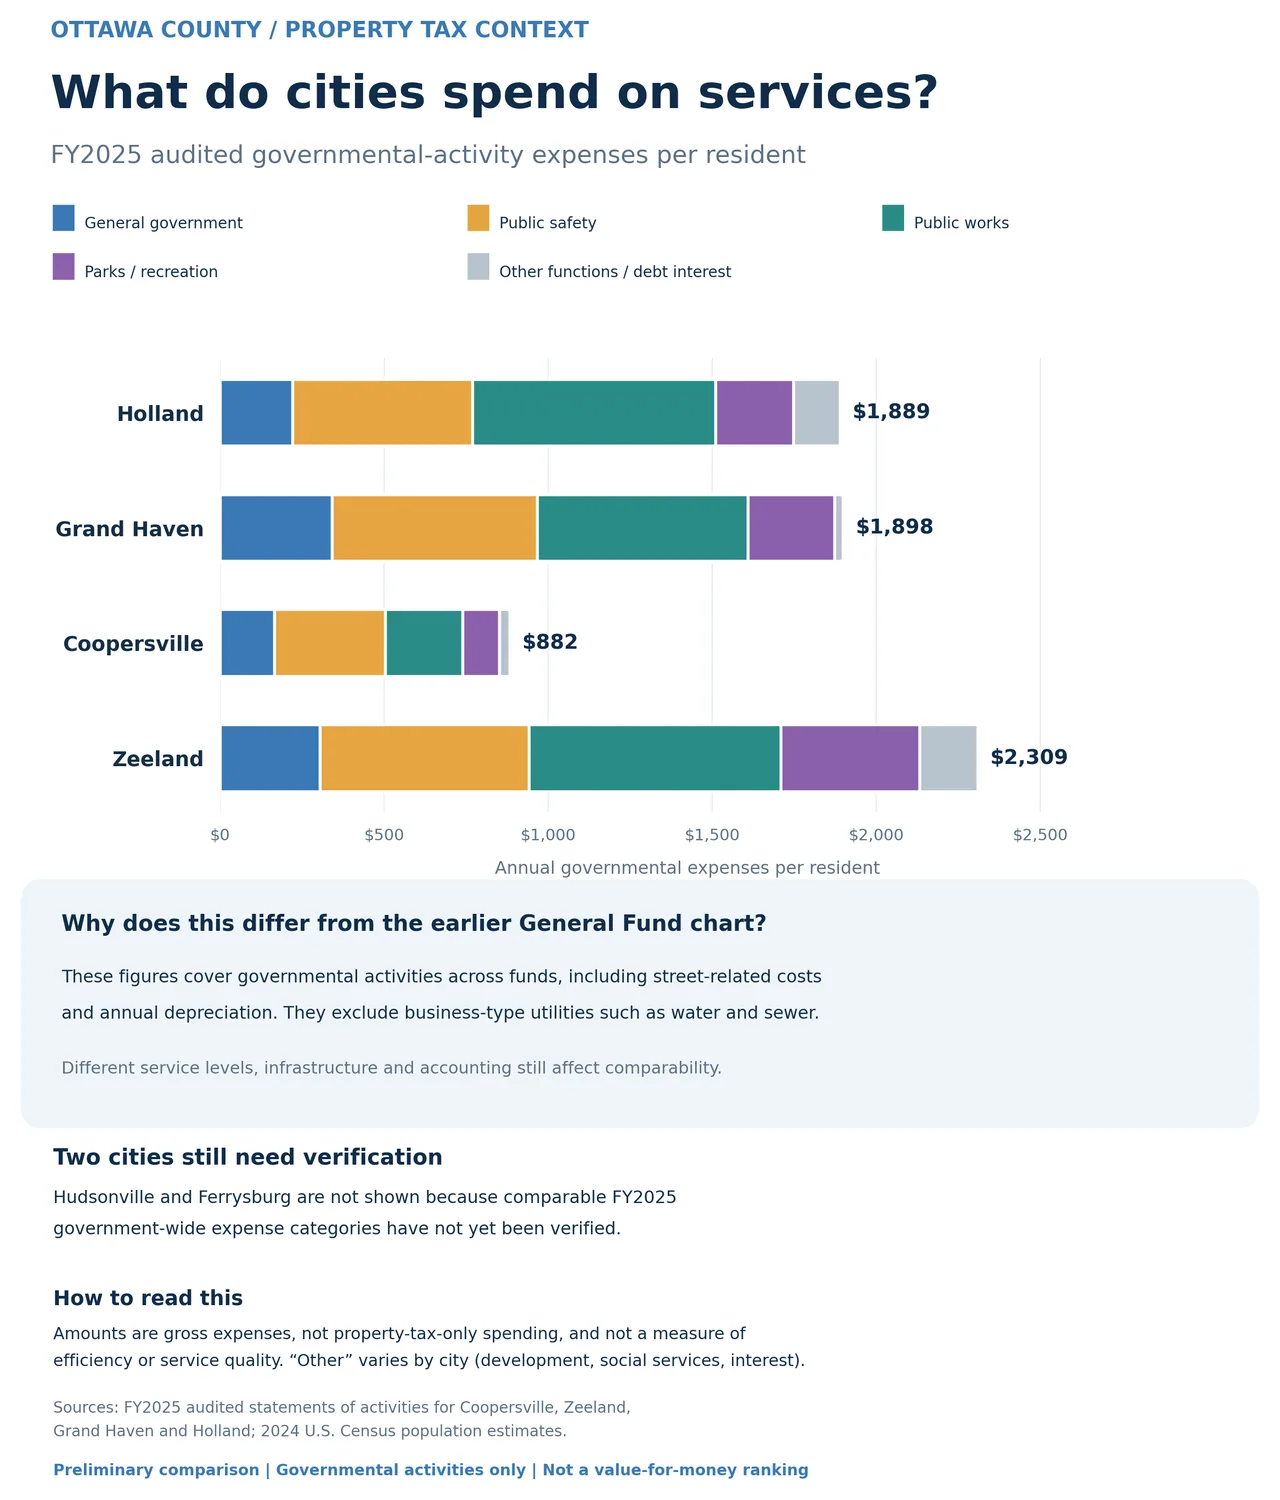
Those differences are substantial, but I wouldn't call them a measure of efficiency. The figures cover governmental activities, including costs recorded outside the General Fund and certain noncash expenses such as depreciation. They do not include business-type utilities, and they're not limited to what property taxes pay for.
Cities also don't provide the exact same services. Some operate their own departments, some contract for services, and some have different road systems, parks, facilities, or long-term obligations.
A city can spend more because it's providing more, because it's investing in aging infrastructure, or because its services cost more to deliver. Lower spending could mean efficiency, fewer services, or work being put off. The totals alone don't answer that.
I could verify comparable fiscal year 2025 governmental-activity figures for four cities, so I left Hudsonville and Ferrysburg out of this spending chart rather than fill in numbers from a different year or a different accounting measure.
Where does that leave us?
After looking at all three comparisons, I still don't think we can answer whether Coopersville residents are getting their money's worth. But I do think we're asking better questions.
I'd like to know more about the condition of our streets and infrastructure, the cost and performance of police and fire services, and whether we're keeping up with maintenance over time.
I'd also like to understand how much comes from property taxes versus state funding, service fees, and other revenue. A single year's spending figure won't settle any of those questions.
I'm on Coopersville's City Council, and I believe we should be able to explain both what residents pay and what they're receiving in return. A smaller tax base is an important part of the story, but it isn't, by itself, a justification for any particular tax rate.
I'll keep looking into it. If there's a city service or financial question you think would be useful to compare, I'd be interested to hear it.
About the data
These graphics use 2025 property tax rates and taxable valuations, 2024 population estimates, and fiscal year 2025 audited governmental-activity expenses. The comparisons are for principal residences where indicated.
The millage graphic combines individual tax levies into four broad categories for readability; those categories do not establish the legal voter-approval history of each levy.
Holland's property tax base and revenue-per-mill values include only its Ottawa County portion. Its spending per resident is calculated for the entire city, with the full-city population. These measures should not be directly compared as if they covered identical geography.
Spending per resident measures costs recognized in governmental activities, not all municipal spending, not property-tax spending alone, and not service quality.
This is a personal review of public information, not an official City Council statement.
Sources:
- Ottawa County 2025 Apportionment Report
- Ottawa County 2024 Population Estimates
- Coopersville FY2025 Financial Statements
- Zeeland FY2025 Financial Statements
- Grand Haven FY2025 Financial Statements
- Holland FY2025 Financial Statements
A Few More Questions About Property Taxes
Since sharing the property tax comparison, I've had several people ask questions or bring up things I hadn't considered. Some of those questions sent me back into the county records to look a little further.
I thought I'd put some of what I've found here for anyone interested.
Does the size of the city make a difference?
I think it does, especially when you consider that even a small city has certain expenses that don't necessarily decrease just because there are fewer residents.
But the comparison between Coopersville and Zeeland is interesting.
Coopersville has about 4,850 residents, while Zeeland has around 5,640. That's only about 800 more people, yet Zeeland brings in nearly three times as much revenue from one mill of property tax.
The difference isn't just population. It's also how much taxable property each community has.
How many homes are in Coopersville? Is that where the $206,000 comes from?
Coopersville has approximately 1,770 housing units, but that isn't what the $206,000 represents.
That number is the estimated revenue one mill generates from Coopersville's regular taxable property value.
It's based on approximately $206 million in taxable property, including residential, commercial, and industrial property. Zeeland has about $593 million.
So it's not just homeowners contributing to the tax base. Businesses and industrial properties are a big part of it too.
Isn't Coopersville larger than Zeeland?
Yes, at least when it comes to land area.
Coopersville covers approximately 4.8 square miles compared with Zeeland's roughly 3 square miles.
But Zeeland has more residents and considerably more taxable property.
One thing I found interesting was the difference in industrial property. Industrial real and personal property make up a much larger portion of Zeeland's tax base than Coopersville's.
That got me wondering about something else. Coopersville has more land to cover, but how do the miles of streets, sidewalks, and other infrastructure compare? That's something I haven't looked into yet.
Why didn't you include Allendale?
I was asked about this, and the main reason is that Allendale is a charter township rather than a city.
Cities and townships don't always have the same responsibilities, particularly with roads. Cities generally maintain their own local streets, while township roads are typically handled by the county road commission.
That doesn't mean we can't compare Coopersville and Allendale. I just wanted to start with communities that have more similar responsibilities.
A comparison with Allendale would need a little more explanation about those differences.
What about the tax abatements for our industrial businesses?
This brought up quite a bit of discussion, especially concerning our dairy operations.
One thing that may not be clear is that businesses with a typical industrial tax abatement on new development are still paying property taxes. Under Michigan's PA 198 program, the local tax rate on qualifying new facilities is generally reduced by 50% during the abatement period.
These abatements aren't necessarily permanent either.
I understand that some of our existing certificates are scheduled to expire at the end of 2026, with others coming up over the next several years. I'm still working on getting a better picture of what that will actually mean for city revenue, since manufacturing equipment and buildings can be treated differently.
Fairlife also has another Industrial Facilities Tax exemption request before the city.
I've asked Dennis for additional information on that request because I'd like to understand what the city would collect during the abatement, what we'd collect afterward, and what additional costs might come with the expansion.
I think we need that information when considering these requests, particularly with established businesses.
What about unpaid property taxes?
Someone also asked how many properties in Coopersville have delinquent taxes.
I don't have that number yet, but I did explain something about how the process works.
When real property taxes go unpaid, they're generally turned over to Ottawa County for collection in March of the following year.
The county has a fund that allows it to advance the unpaid tax revenue to the city and other taxing authorities while it works on collecting those taxes.
So someone owing delinquent property taxes doesn't necessarily mean the city hasn't received that revenue.
I've asked Dennis whether we have some rough numbers on how many properties are involved and how much is outstanding. I'm also curious whether that number has changed much over the years.
There's no rush on getting that information, but I'll share what I find out.
Has Coopersville always been a high-tax, high-service community?
One resident mentioned that Coopersville has had that reputation since at least the early 1990s. They also said they've generally been happy with how responsive city services are and feel they've received good value for their taxes.
I thought that was worth mentioning because it's something the financial numbers don't tell us.
We can compare how much cities spend on public safety, streets, parks, and other services. But that doesn't tell us how quickly a problem gets addressed, how well the services are delivered, or whether we're keeping up with maintenance.
That's a harder comparison to make, but one I'd like to explore further.
Still More to Learn
When I started looking at the original property tax graphic, I really just wanted to understand why Coopersville appeared so high compared with other communities.
I wasn't expecting to get into taxable property values, industrial development, tax abatements, and all these other questions.
I'm finding some interesting differences between communities, but I still don't think we have enough information to say whether Coopersville's 13-mill rate is too high, too low, or about right.
I appreciate everyone who's taken the time to ask questions or share their experiences. Several of those comments have given me something new to look into.
I'll keep adding information as I find it.